As one of the most far-ranging and devastating neurologic diseases, epilepsy afflicts over 50 million individuals worldwide. The most diasabling aspects of seizures are its unpredictability, potentially life-threatening impairment of consciousness, and the embarrassment of incidences, which can lead to social isolation and even misbehavior.
Therefore, for our CS109a project, we decided to study seizures and our ability to predict them. Our goal has been to build a model that can determine the factors that affect epilepsy recurrence and predict future seizure incidences given the individual's identity, medical history, social behavior, etc.
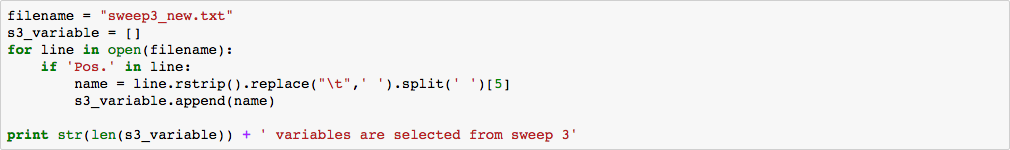
Sweep 0-3 (Age 0-16) of 1958 National Child Development Study, which tracks every child born in the UK during a single week in 1958. 1026 out of 18558 children developed syndrome like epilepsy and convulsion before age 11. 250 of them relapsed by age 16.
Analysis of NCDS data is challenging for three reasons: 1) The primary goal of the study is not focused on seizure, so useful information of seizure prediction is scarce; 2) The study is a longitudinal survey-based study, so large volume of missing data is expected; 3) The study contains repeated questions collected for each sweep, so high collinearity between covariates exists.
We selected individuals who were hospitalized, handicapped or absent from school due to epilepsy or convulsion, and got 1026 children with seizure before age 11, 250 of whom relapsed by age 25.

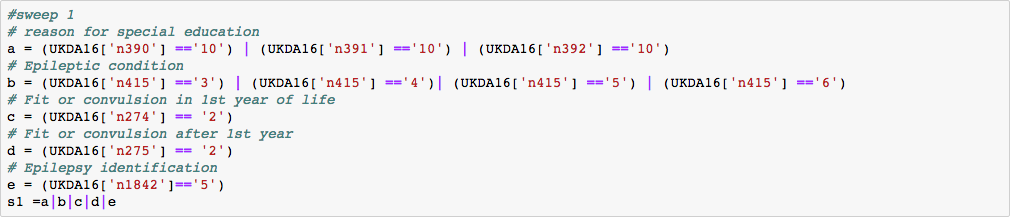
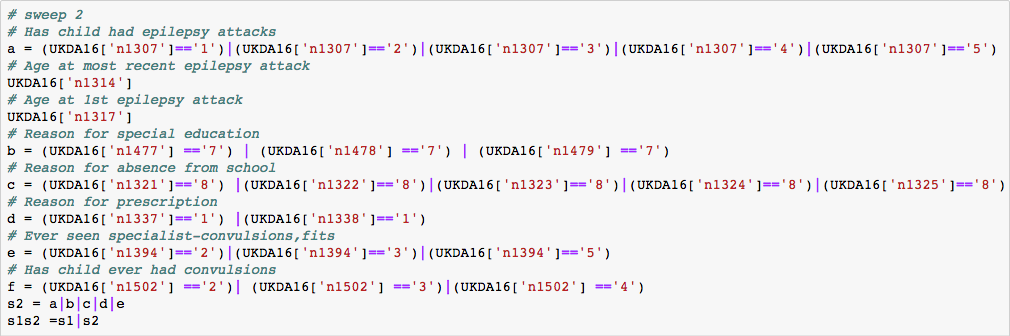
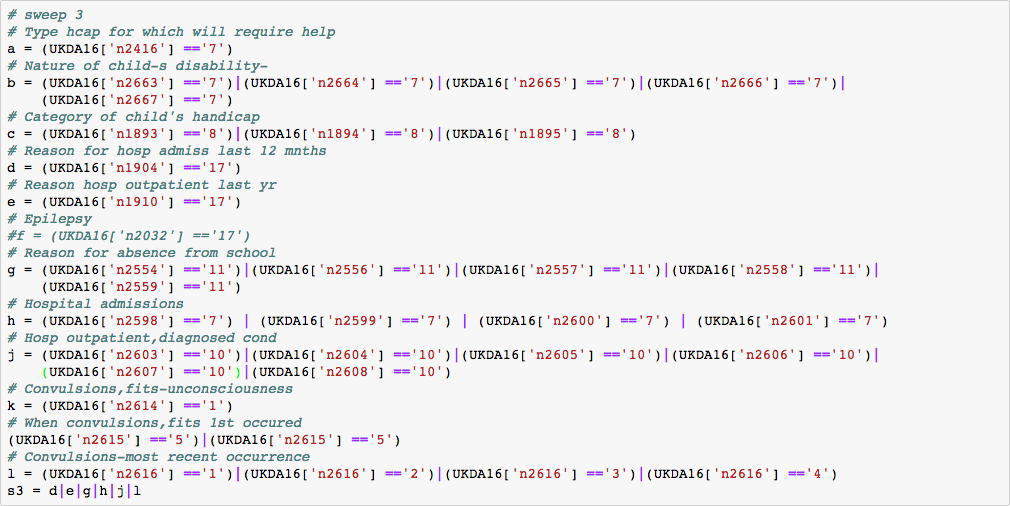
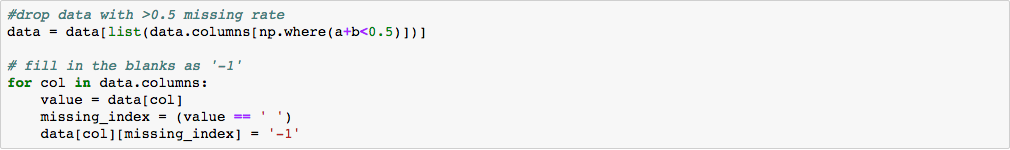
Based on subject matter knowledge, we extract 207 social economic status and medical related variables. After dropping columns with a missing rate higher than 50%, 188 variables remain for analysis.

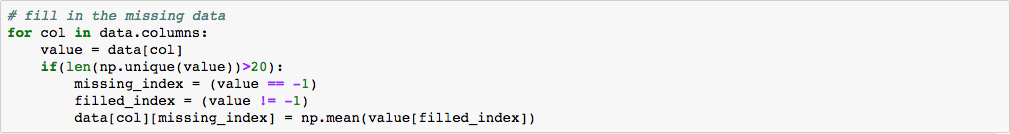
Variables with missing rate higher than 50% were deleted directly. For continuous data, we fill in as column mean. For categorical data, we tried two different strategies: 1) fill in the most frequent category, 2) fill in as ‘missing’ category. The second one turned out better than the first in terms of prediction accuracy, so the ‘missing’ strategy was adopted.


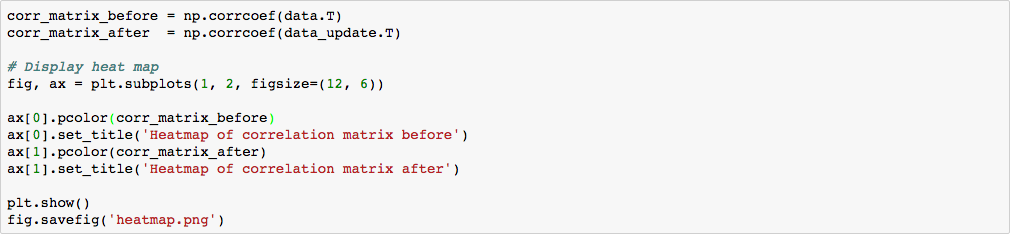
Multi-collinearity was checked by calculating variance inflation factor (VIF). We adopted a backward elimination strategy to delete variables with high correlation with others iteratively. VIF was calculated for each variable in the dataset and the variable with the highest VIF were deleted in each step until no VIF is higher than 10 according to the rule of thumb. 88 variables left after this process.
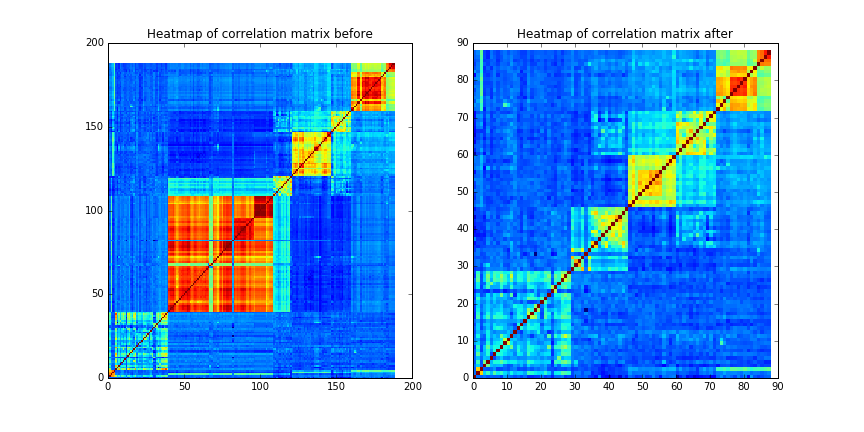
Due to the imbalance nature of the dataset (776 non-relapse subjects and 250 relapse subjects), we adopted two strategies to combat this problem: 1) use weighted models 2) under-sample non-relapse subjects and over-sample relapse subjects.
Decision Tree, Random Forest, Linear SVM, Logistic Regression, LDA and QDA were considered for model building. L1 penalty were used for Logistic Regression and SVM to handle potential collinearity. Quadratic effects of Logistic Regression and SVM were not considered given that 87 out of 88 variables are categorical. After tuning the regularize parameter (max_depth for Decision Tree and Random Forest, C for Linear SVM and Logistic Regression) via cross validation and select the parameter which maximize the overall accuracy of training set.
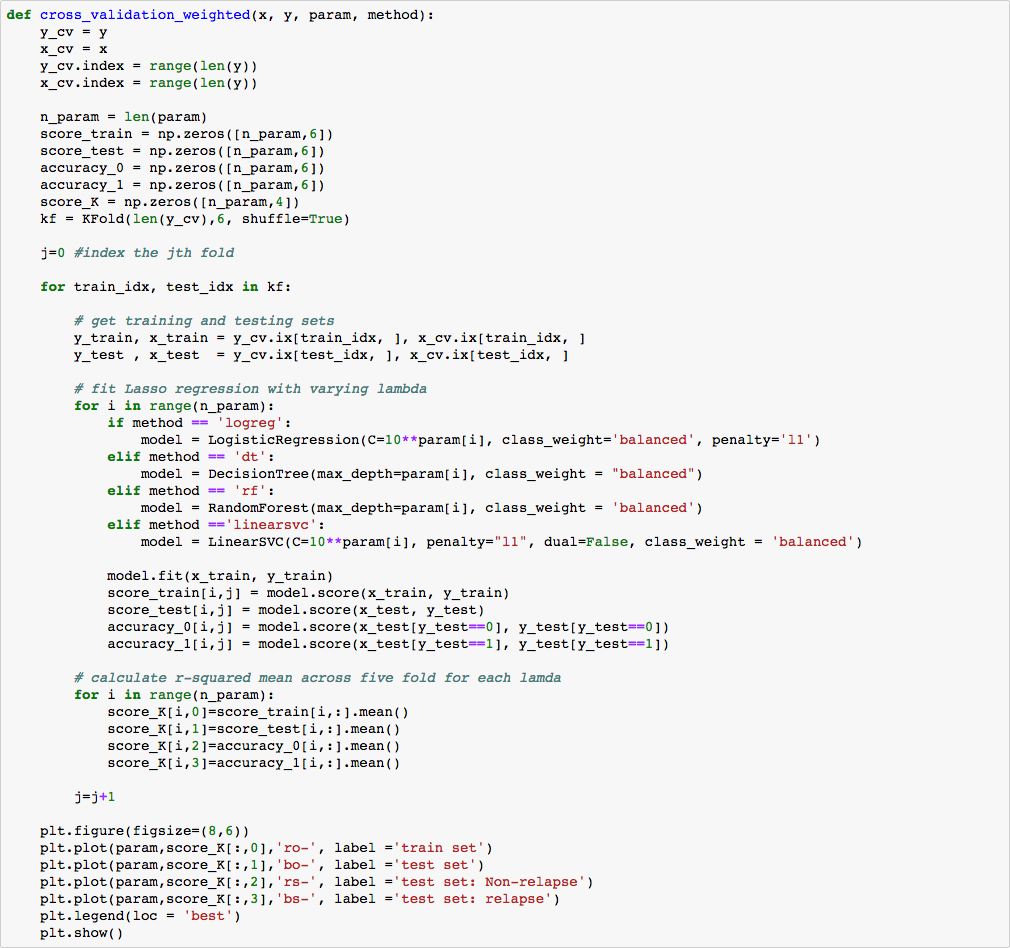
To compare performance of different methods, we randomly split training and testing set for 100 times, recorded accuracy on whole dataset, class 0 (non-relapse) and class 1 (relapse) for each model, and finally plot their distribution as follows.
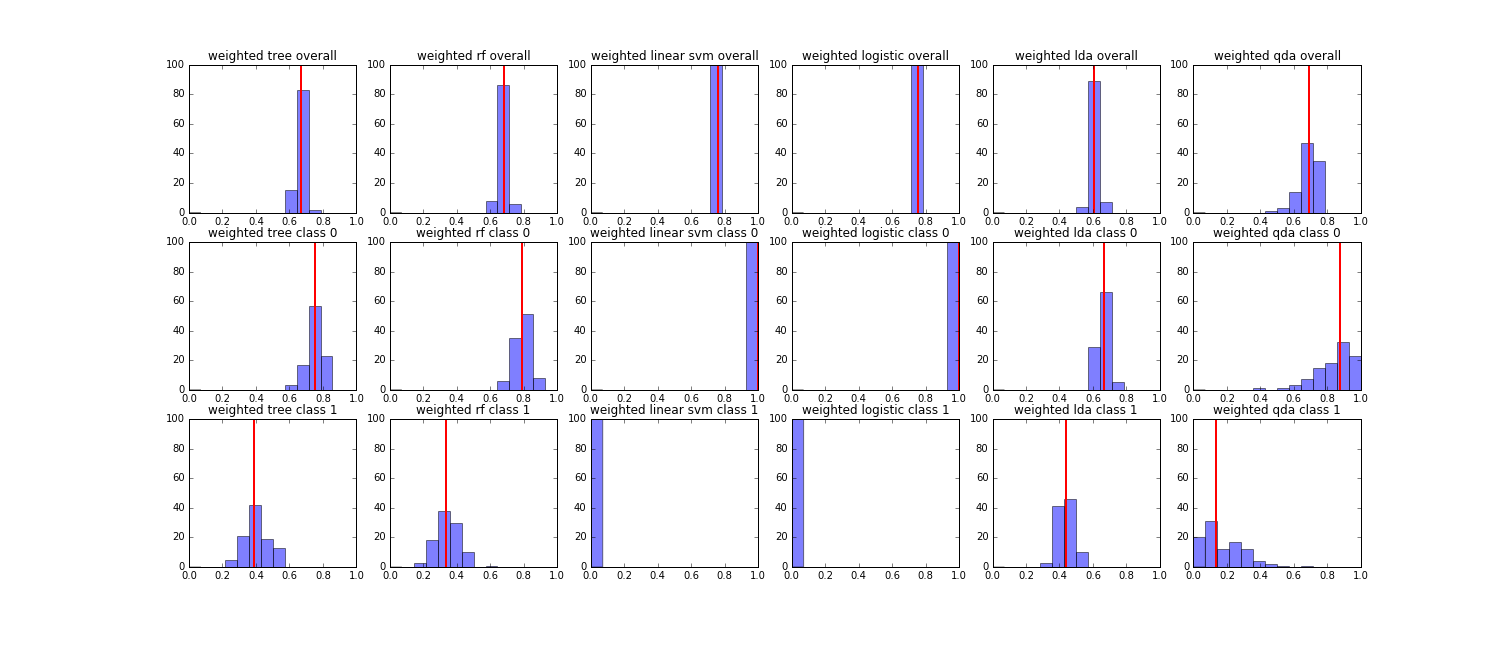
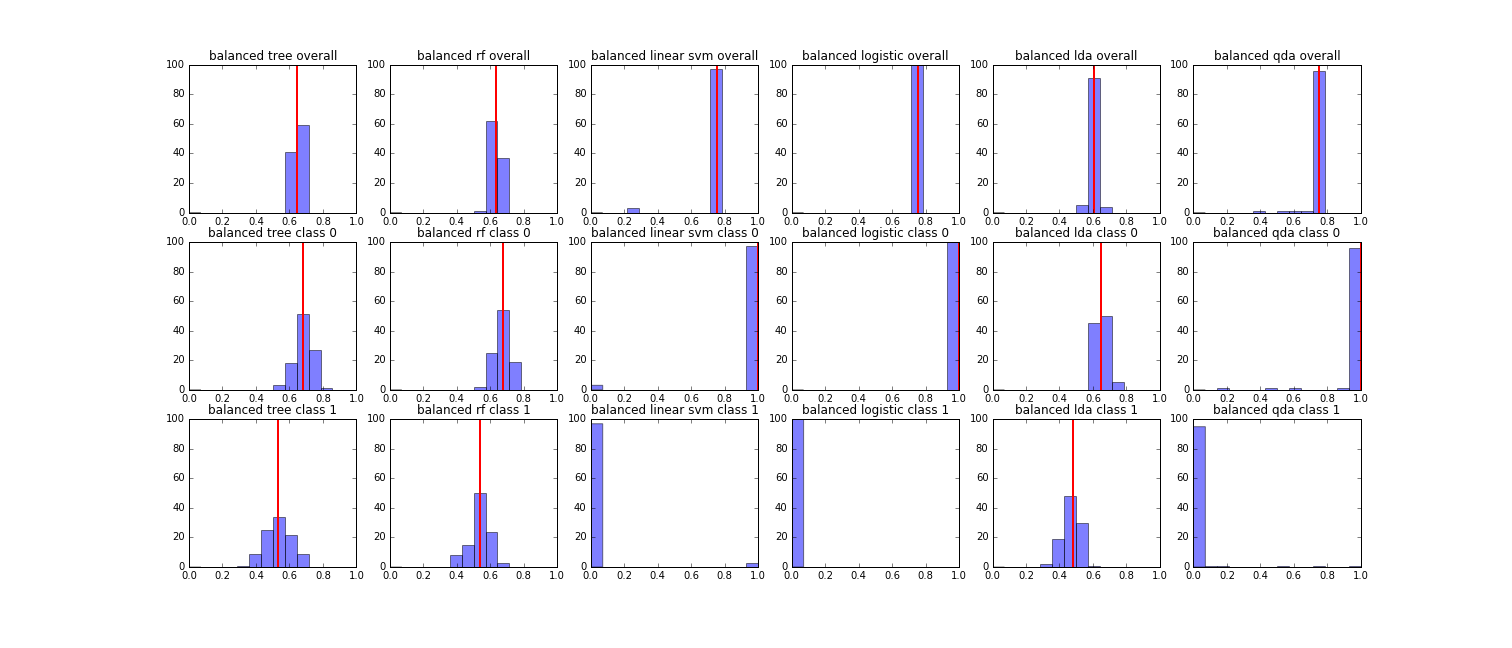
We found that for both strategies, Linear SVM and Logistic Regression had the highest overall accuracy around 0.7, but they classify all subjects as non-relapse. For each strategy, Decision Tree, Random Forest and LDA were close in overall accuracy and accuracy for each class owing to the fact that we delete variables with high multi-collinearity with other variables. It’s hard to decide which model to choose. Given that Random Forest, which randomly select features for tree building, is less susceptible to collinearity by nature, we decided to use Random Forest. Also we found that although the overall performance for Random Forest were close in two strategies (around 0.65), the accuracy of class 1 (relapse) are higher in resampling balanced sample strategy and the weighted model strategy (around 0.4 for weighted strategy, around 0.5 for resampling balanced sample strategy). Finally, we decided to adopt Random Forest based on resampling balanced sample strategy.
Based on our random forest model, the most important 20 features include personalities, medical-related factors (mostly associated with heart and blood), social economic status, etc. These findings make intuitive sense, and are adherent with our previous literature studies. The top three important features are "whether the child prefer doing things on him/her self, i.e. solitary personality"; "Whether the child has temper tantrums in past 12 month"; and "whether the child has any illness during the past 12 months". One interesting finding is the role of the region of birth and the region they live in at the year of 16, we'll take a closer look at this geographical variable later.
From the above data visualization, we can tell that the relapse of epilepsies is associated with solitary personality.
From the above data visualization, we can tell that the relapse of epilepsies is associated with frequent temper tantrums in the past year.
It seems that the relapse group has more incidences of dysmenorrhea and high fever during the previous year.
It seems like more children with relapsed epilepsies in the NCDS dataset live on the southeast or east part of England when they were 16 years old. However, taking the relative large percentage of missing values presented for the non relapsed group into consideration, the differences on region is hard to tell between the two groups of interests.
The 1958 NCDS dataset is a social survey-based longitudinal dataset, which imposes two difficulties. First, a large amount of missing value existed in the dataset. We assign ‘missing’ to missing values in categorical data, and the mean value to missing values in continuous data. We may improve the data analysis by using more complicated methods such as multiple imputation. But if the data is not missing at random, our results will remain biased. The second problem is that although 18558 children were followed up in the longitudinal study for almost 20 years, there is a limited amount of useful information in terms of seizure prediction. This is the nature of longitudinal study, but the problem could be addressed by designing a study targeted specifically at epilepsy analysis.
We have presented a seizure prediction model for the 1958 National Child Development Study. The model fit a Random Forest in the training set to predict seizures in test set (taking the majority as the result). This model yielded an overall accuracy of 0.615260 and a test accuracy of 0.617647 for non-relapse group and a test accuracy of 0.607143 in relapse group.

I am an Astronomy grad student at Harvard studying the formation of black holes in the Early Universe.